
Changes in geographic access to Endovascular Stroke Center by Year (2015-2019) in PA, NJ, NY, DE.

Source: https://www.sciencedirect.com/science/article/pii/S1052305722005663?dgcid=coauthor
Derek L. Isenberg, Chadd K. Kraus, Kevin A. Henry, Daniel Ackerman, Derek R. Cooney, Ethan Brandler, Alexander Kuc, Jason T. Nomura, Joseph Herres, Adam Sigal, Kelley Simon, Jenna Mylin, Nina T. Gentile, Evolution of endovascular stroke centers and disparities in access to stroke care in four Northeastern states: 2015-2019,
Journal of Stroke and Cerebrovascular Diseases, Volume 32, Issue 1,2023,
Geographic Variation of Amyotrophic Lateral Sclerosis Incidence in New Jersey, 2009–2011
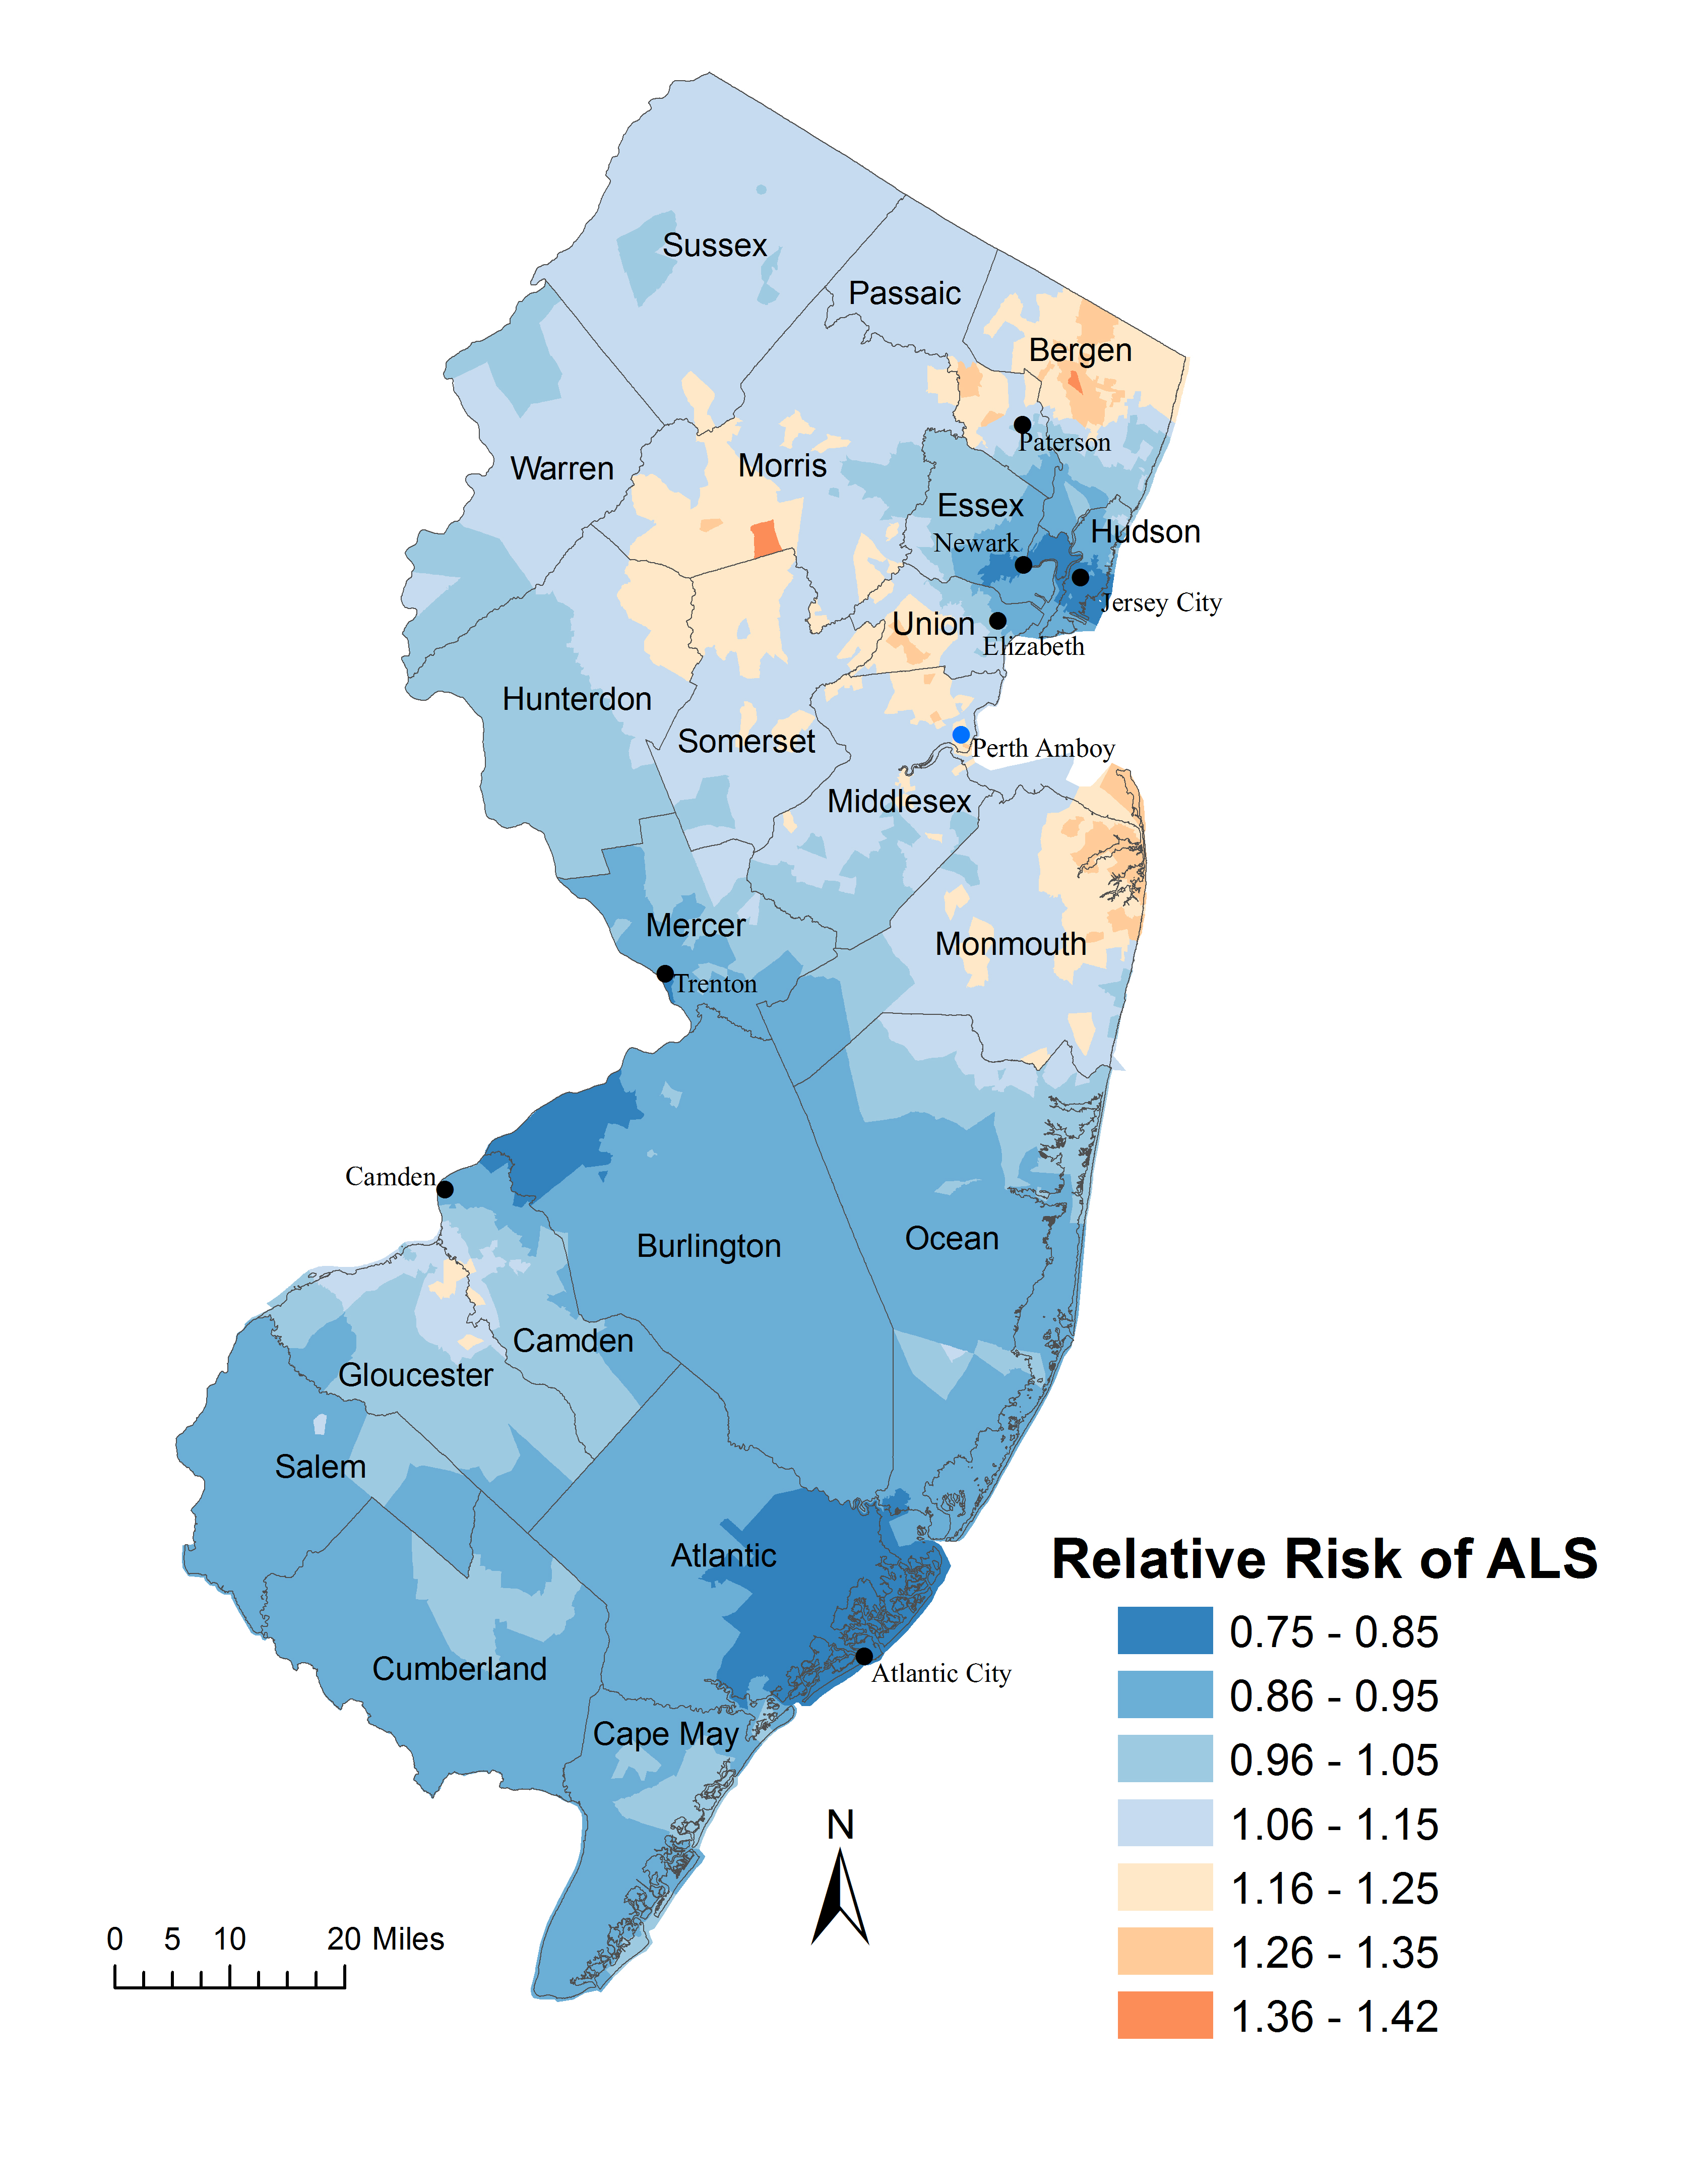
Geographically smoothed relative risk map of amyotrophic lateral sclerosis (ALS) in New Jersey, 2009–2011. The map is based on results from a Bayesian geoadditive model with adjustment for age and sex.
Kevin A. Henry, Jerald Fagliano, Heather M. Jordan, Lindsay Rechtman, Wendy E. Kaye, Geographic Variation of Amyotrophic Lateral Sclerosis Incidence in New Jersey, 2009–2011, American Journal of Epidemiology, Volume 182, Issue 6, 15 September 2015, Pages 512–519, https://doi.org/10.1093/aje/kwv095
Female Breast Cancer Survival in New Jersey (Diagnosis Years 2010-2014)

Spatial distribution of Hazard Rates in NJ. Hazard Rates > 1 indicate an elevated risk of death from breast cancer. Green boundaries indicate significant clusters of lower risk of death from breast cancer. Yellow boundaries indicate significant clusters of higher risk of death from breast cancer. Maps based on spatial Bayesian models. Link to paper
The diffusion of digital mammography in the United States, 2001-2014

The mammography data from the webmap has been modified slightly. If you use this data for any purpose (websites, publications) please reach out to medicalgeography@yahoo.com for permission. FULL PAGE MAP
Reference: Wiese, D., Stroup, A. M., Islami, F., Mattes, M., Baylor, E., Boscoe, F. P., & Henry, K. A. (2023). Geographic diffusion of digital mammography in the United States.Cancer, 129(14), 2144–2151. https://doi.org/10.1002/cncr.34774